
The Philosophical Gourmet Report (PGR) is a data resource for prospective graduate students in philosophy to help students choose which graduate programs to pursue. Based on survey data collected from philosophers, the report offers scores and rankings of philosophy PhD-granting Institutions throughout the English-speaking world. To help improve the PGR’s accessibility and impact, I’ve utilized some data analytics methods to create visualizations, analyses, and a relational database for all publicly available PGR data. The database and dashboard projects each have their own page where I detail the entire process I used to create the necessary tools and perform the analysis. Interested readers can explore these pages to get a fuller sense of the processes behind the project.
On this page, I’ll summarize the most interesting findings, visualizations, and analyses without detailing the process I used to arrive at or generate them. I will, however, liberally include links that interested readers can follow to see how I arrived at my conclusions. I’ll be continually adding to this page so stay tuned for new analyses and updates. I’ve mostly organized the findings as answers to specific questions.
Contents
Introduction and Methodology
The purpose of this project is to offer analyses of the data on PhD-granting philosophy institutions gathered by the Philosophical Gourmet Report (PGR) from 2006 to 2021 in order to increase its accessibility and utility. The data was generated by surveying philosophers about the overall quality of PhD granting-philosophy institutions in the English-speaking world, and thus is a reflection of professional sentiment towards philosophy departments.
The scores fall into two broad categories: Overall and Specialized. To determine Overall scores, evaluators were asked to rate the quality of PhD granting departments from 0-5, and the report shares the central tendency of the data using various metrics, most commonly the mean, median, and mode. (Since 2017, lower and upper confidence interval was also added.) The Specialized scores represent an institution’s quality with respect to specific areas of specialization within major areas of philosophy. The data points here also include median and mode scores, but further includes a “rounded mean” score, whose values are limited to increments of 0.5 points. Additionally, the rankings only include values of 3 or above.
The PGR has had no shortage of detractors and critics over the years, and readers should judge for themselves how much stock to put into the ratings and rankings as measurements of the quality of PhDs an institution produces. Nevertheless, it is the only dataset of its kind, so far as I know, in terms of its comprehensiveness and history, which now comprises some 20 years’ worth of survey data from hundreds of professional philosophers.
Currently, however, the PGR’s public dataset exists only in a series of tables scattered across different PGR websites, which is a limiting factor in the data’s accessibility and utility. For example although the PGR 2021 Overall Rankings offers historical rankings of institutions back to 2006, it does offer the previous mean scores used to determine the rankings, which instead must be sought out on the sites for prior iterations of the PGR.
Additionally, it’s difficult to analyze the combined data for the specialized scores with the overall scores. The “Summary of Specialty Rankings” page lists all the top institutions alphabetically, and includes rows for all specializations regardless of an institution’s score, while the “Breakdown of Programs by Specialty” pages rank institutions’ scores within a specialization without any Overall data.
To remedy both issues, I’ve created a queryable relational database using the available PGR data from 2006 as well as interactive dashboards to make the most of the PGR’s data. These tools will facilitate individual evaluations of institutions and departments as well as broader analyses of trends across philosophy institutions. In what follows, I’ll highlight some of the most interesting findings I’ve been able to generate using both sorts of tools.
Overall Scores
Which institutions’ mean scores fluctuated the most since 2006?
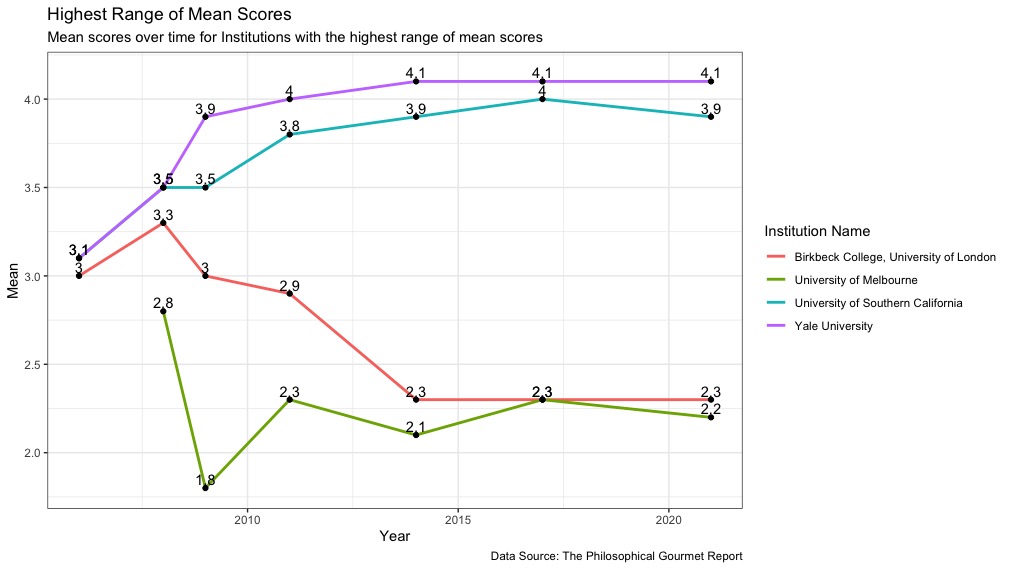
- Yale University (2021 overall rank 6) had a spread of 1-point over a cumulative increase in its mean score since 2006, which is the highest mean range of any institution. It began in 2006 with a score of 3.1, but then jumped up to 3.9 in 2009, and has edged upwards ever since, settling in at 4.1 for the past 3 iterations of the PGR (Figure 1).
- The University of Southern California (2021 overall rank 9) increased its mean score by 0.9 between 2006 and 2017, from 3.1 to 4, but its score went down to 3.9 in 2021 (Figure 1).
- Birkbeck College, University of London began with a score of 3 in 2006, went up to 3.3 in 2008, but then began trending downward 1 whole point between 2008 and 2021 (Figure 1).
- The University of Melbourne saw a massive drop in its score between 2008 and 2009. I wonder what happened! I suppose there must have been some major faculty moves (Figure 1).
- The 4 institutions with the largest mean score range occurred across the overall rankings, with representatives near both the top and bottom of the overall mean scores.
- Click here to see the full process for generating the data and visualization.
Figure 1:
Which Institution’s mean scores fluctuated the least since 2006?
To make this a somewhat more meaningful metric, I had to exclude institutions with two or fewer entries in the PGR. A few Institutions were only ranked for two consecutive iterations before then falling off the rankings. Only two universities have had a range of mean scores of less than 0.2 points. Many more had fluctuations of 0.2 points.
- Institutions with a range of mean scores of 0.1 or less and with mean scores for 3 or more iterations of the PGR include Purdue University and the University of Cincinnati (Figure 2).
- Purdue University‘s overall mean score has fluctuated between 2 and 2.1 since 2009.
- The University of Cincinnati’s overall mean score has gone from 1.8 in both 2009 and 2014 to 1.9 in 2021.
- Click here to see the full process I used to generate the data and visualization.
Figure 2:

How was fluctuation in mean score since 2006 distributed?
- 74.77% of all Institutions’ mean scores fluctuated between a 0.2 and 0.5 points (Figure 3).
- Only 25.23% of Institutions fluctuated greater than 0.5 points or less than 0.2 points in their overall mean scores (Figure 3).
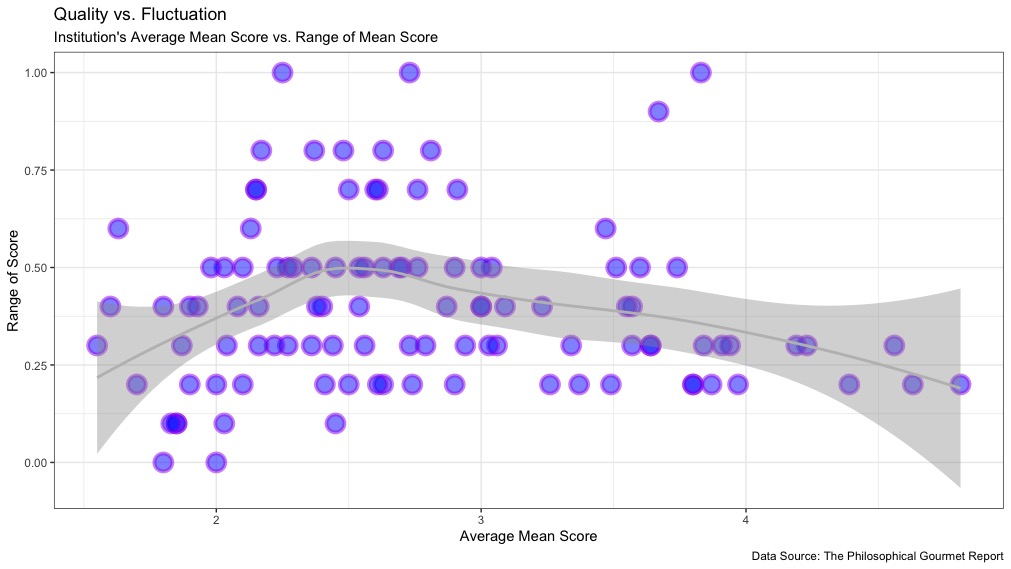
- Institutions with mean scores between 2 and 3 on average saw the greatest fluctuation in their scores over time (Figure 4).
- On average, the higher an institution’s mean score, the less it fluctuated (Figure 4).
- Click here for a fuller discussion of these visualizations and how I created them.
Why do Institutions with higher scores tend to fluctuate less? I can think of at least two possible explanations:
- Institutions with lower rankings may have higher faculty turnover rates, and thus their scores tend to fluctuate more. If overall quality is a product of faculty quality, then high quality fluctuation implies high turnover. Assuming that the best departments tend to have better faculty retention, this makes good sense. But that’s just an assumption, and one that could presumably be informed by data.
- As we saw with my earlier Visualizations, quality and quantity tend to track one another in philosophy departments. Thus, even if the rates of faculty turnover are similar across PGR ranked departments, we wouldn’t see the same fluctuation in scores at the large, high-scoring departments that we would at smaller and lower-scoring ones.
Figure 3:
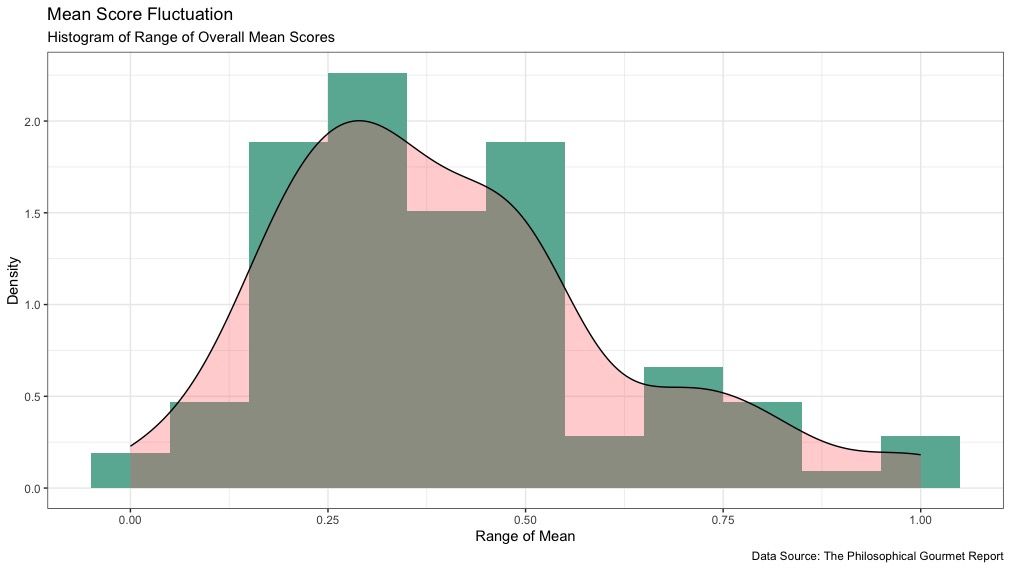
Figure 4:
Specialized Scores
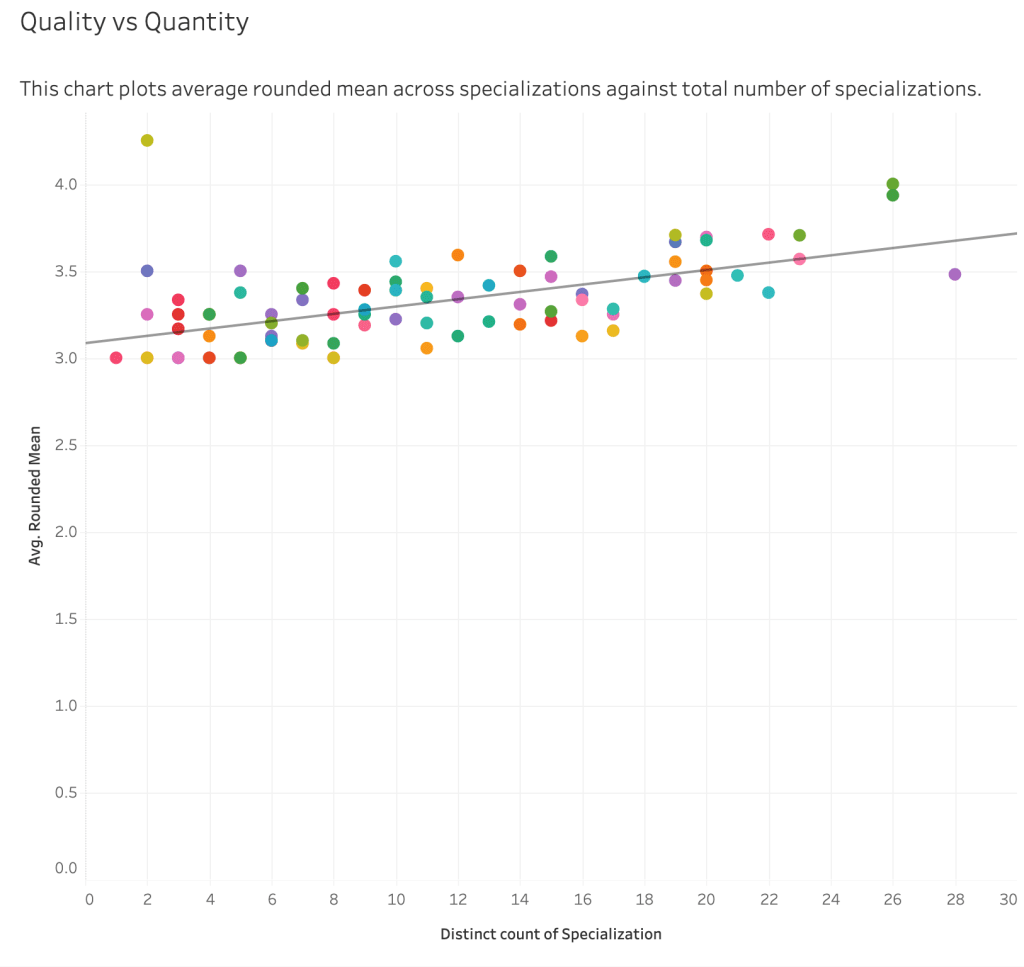
How do the quality and quantity of specializations at an Institution relate to one another in the 2021 PGR?
- The more Specializations an Institution has, the higher-scored those specializations tend to be (Figure 5).
- The University of Toronto offers the most specializations of any Institution, but on average those specializations score lower than those of New York University and Oxford University.
- Saint Louis University is an outlier of note: It has only 2 Specializations, but they have very high scores: 4.0 for the Philosophy of Religion and 4.5 for Medieval Philosophy.
- Click here to see the full visualization of the quality and quantity of specializations across all institutions.
Figure 5:
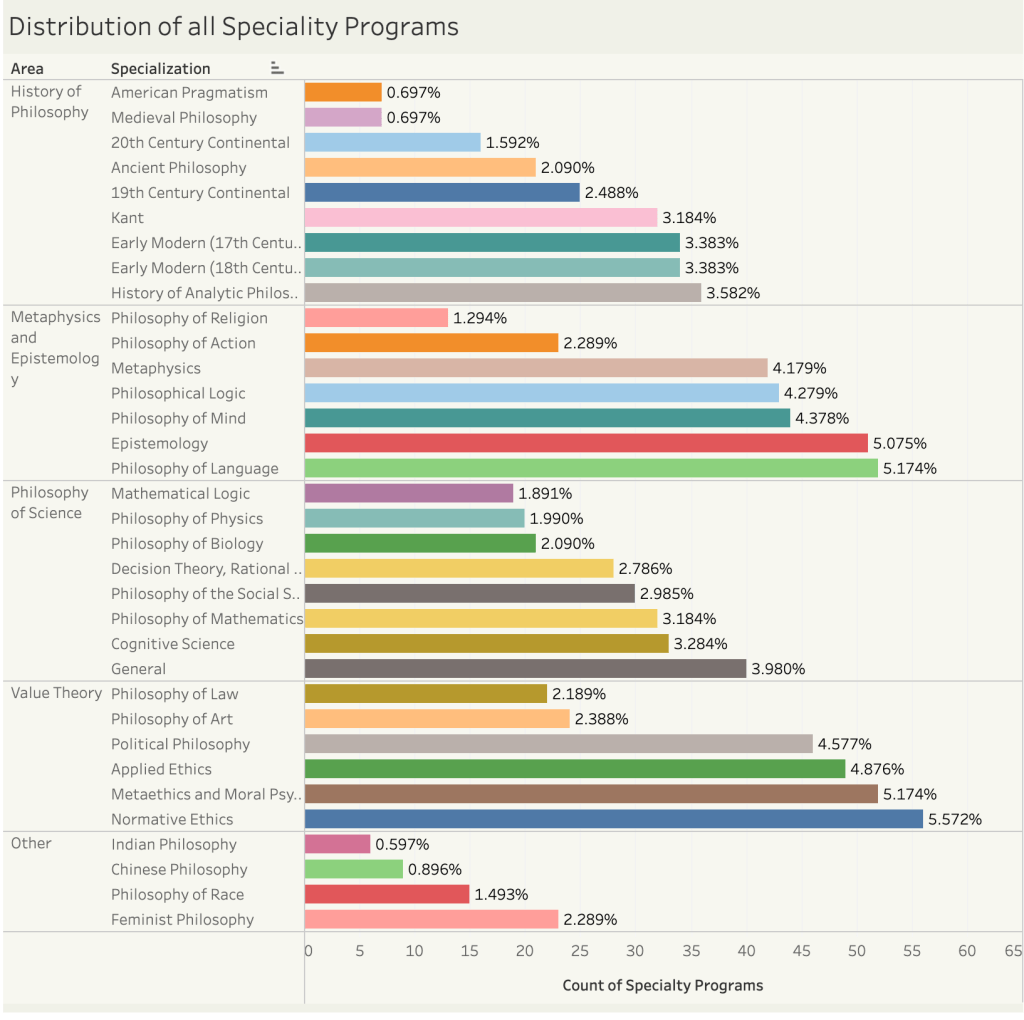
What are the most and least common Specializations in the 2021 PGR?
- The most common Specialization is Normative Ethics with 56 Specialty Programs, accounting for or 5.572% of all Specialty Programs (Figure 6).
- The top 4 most common Specialty Programs are in Normative Ethics, Metaethics and Moral Psychology, Philosophy of Language, and Epistemology, which combined constitute 21% of all Specialty Programs (Figure 6).
- The least common Specialty Programs are in American Pragmatism (0.697%), Medieval Philosophy (0.697%), Chinese Philosophy (0.896%), and Indian Philosophy (0.597%) (Figure 6).
- Click here to view the full interactive dashboard.
Figure 6:
How can we compare an Institution’s Specialized and Overall scores?
The following visualizations compare an Institution’s Specialized and Overall scores within an Area of philosophy:
- Metaphysics and Epistemology
- Philosophy of Science and Mathematics
- History of Philosophy
- Value Theory
Links
Additional Project Pages
- Creating the PGR Database
- PGR Visualization Dashboards by Specialization
- Calculating the Range of Institutions’ Overall Mean Scores
- Overall Weighted Mean and Standard Deviations
Personal Links
