
Upon making some progress with my Visualizing the Philosophical Gourmet Report (PGR) project using Excel and Tableau, I’ve decided to create a relational database of all the publicly-available PGR data and document the process on a new page: The PGR Database Project. The goal of both projects is to increase accessibility and utility of the PGR data and thereby facilitate analysis by prospective graduate students in philosophy deciding on which programs to pursue or attend.
To this end, I think Visualizing the PGR is a step in the right direction, but a somewhat limited one in so far as it relies on rather clunky spreadsheets that may not be scalable for future iterations of the PGR. Additionally, the PGR dataset gives us good insight into changes in institutions and specializations over time, and so it is a problem that the current Excel + Tableau methods of generating visualizations and analyses have trouble scaling to previous iterations of the PGR. The solution: Create a relational database that can handle all the data from past, present, and future iterations of the PGR.
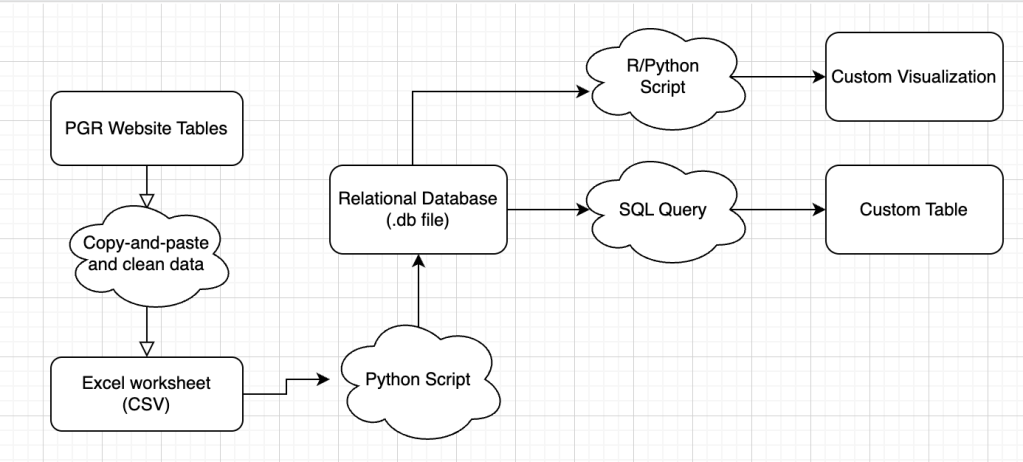
The workflow will be as follows: move from 1) PGR website to 2) CSV file to 3) database (.db) file to 4) custom tables and visualizations. The move from 1) to 2) will be using brute force: copy-and-paste from the PGR site to Excel for data cleaning. The move from 2) to 3) will require a Python script to create the tables and populate the database. The move from 3) to 4) can use a variety of methods, including SQL, Python, or R. The flowchart looks something like this:
Of course, the flowchart above assumes that the user knows how to access the .db file using Python, R, or SQL, which isn’t a safe assumption at all! Thus, the project will actually require a user interface of some sort that allows users to access custom tables and visualizations with relative ease, serving as an intermediary between the database and the visualizations. The flowchart would then look something like this:

I’ll have to build some sort of interface to accomplish this in order for the project to be maximally useful, but I hope that readers nevertheless find the database itself useful as well as the custom tables and visualizations that I generate for my own analyses. You can keep track of the project at the PGR Database Project page. Stay tuned for updates!

Leave a comment